30DayMapChallenge 2026
A new map every day in November
A different approach to the challenge this year. Rather than making maps from interesting datasets, each map starts with a question and some analysis. Everything is built with cloud-optimized point clouds, rasters and vector tiles, served directly from object storage without a tile server or database.
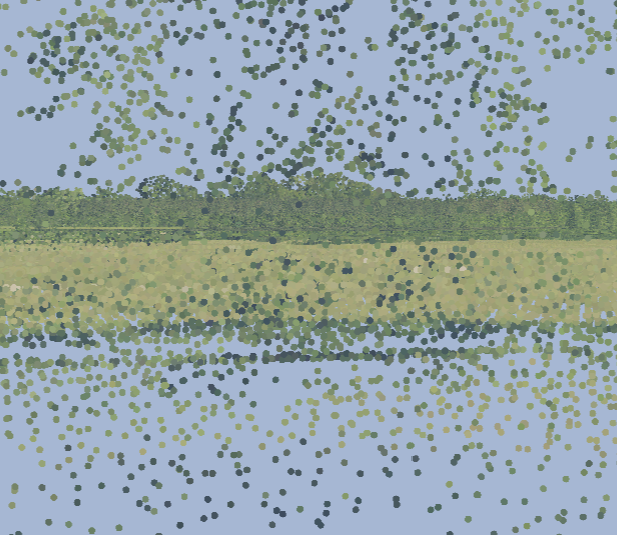
Where the shadows fall
A pasture in Marengo County, Alabama as a lit lidar surface: the woods throw real December 21 shadows across the field, and the ground that stays dark is measured, not estimated.
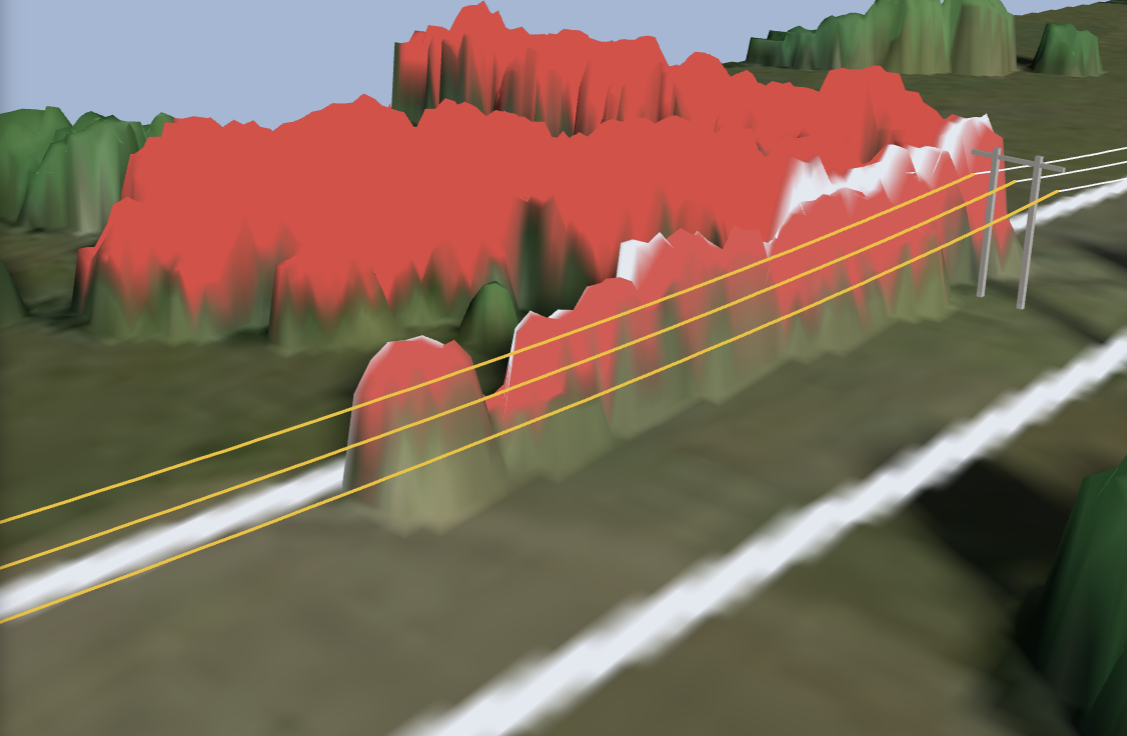
The circuit and the trees along it
A 115 kV transmission line in Marengo County pulled from public lidar tower by tower, a catenary fit for every span, and every tree in the right of way measured against the nearest conductor.
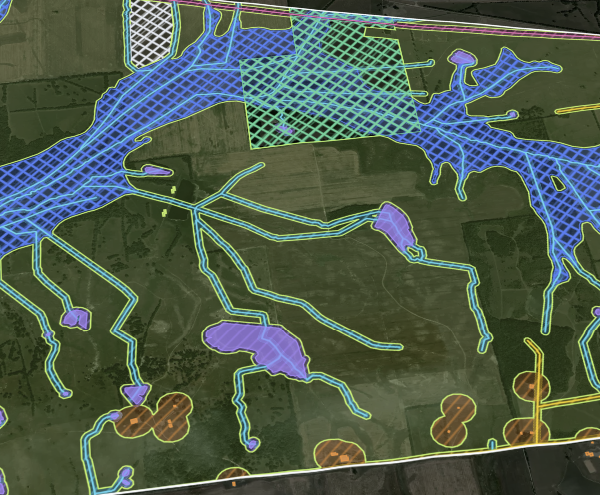
The screen
The 5,927 acre Phoebus demo AOI run through a public constraint screen: floodplain, streams, protected land, structures, roads, rail, pipeline and slope each take their bite, and the counter falls to the buildable acres.
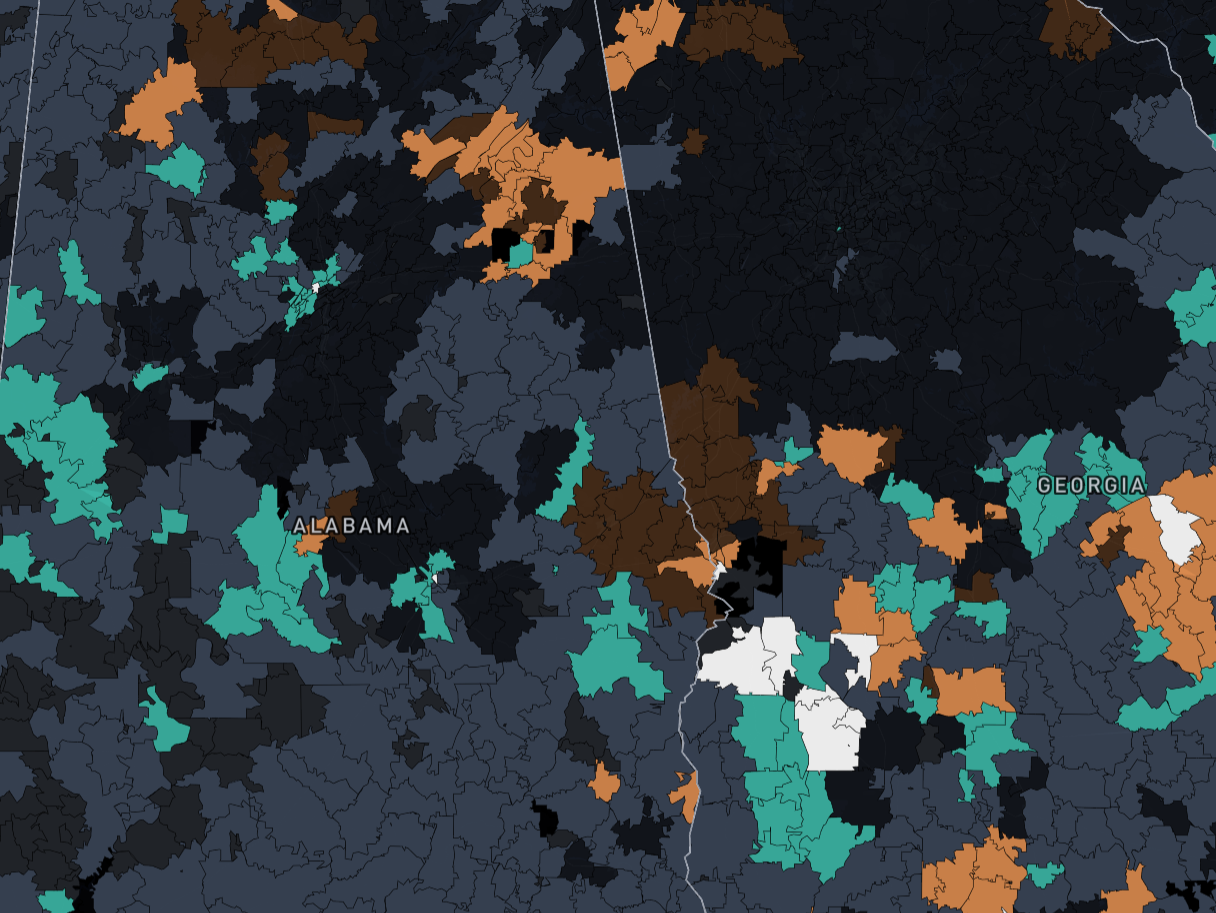
Where your cash works
Type the cash you have saved and 2,258 ZIPs across Alabama, Mississippi, Georgia and South Carolina sort into four screening types under stated assumptions: potential cash flow, forecast appreciation, both, or neither.
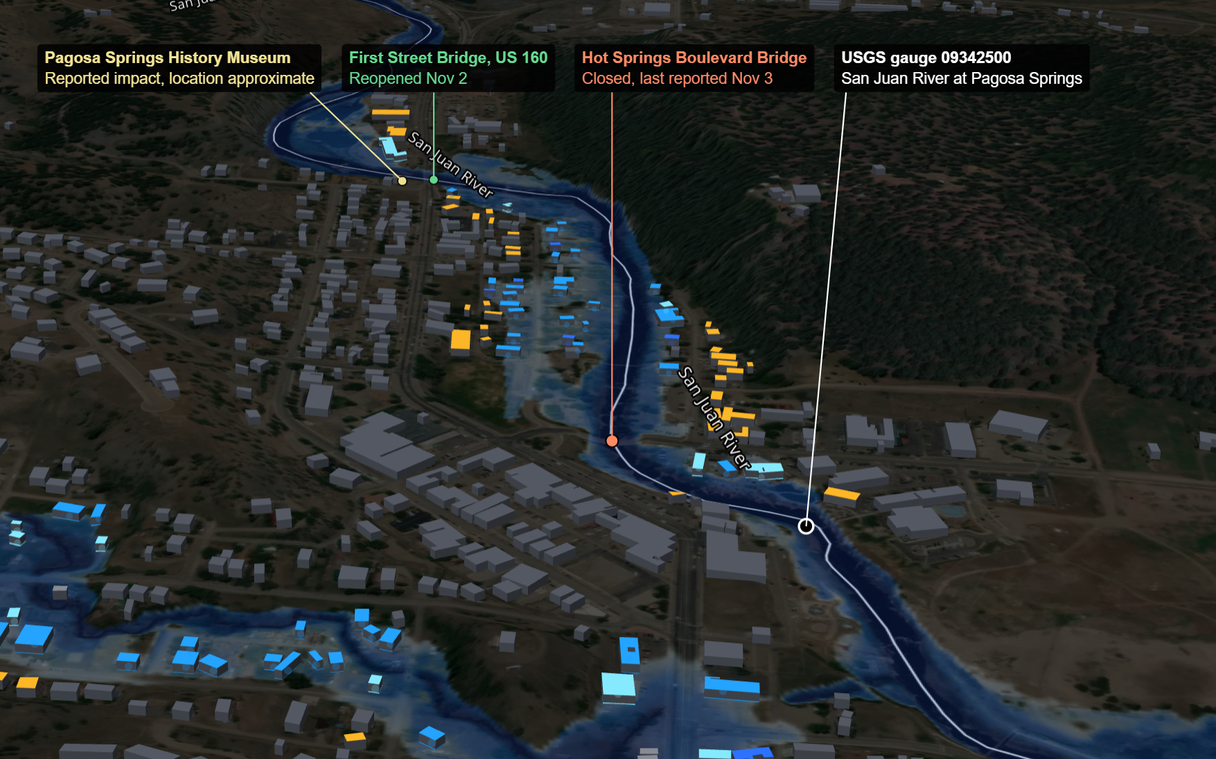
See the water line
Where FEMA's map reaches buildings in the Pagosa Springs corridor, beside the 2026 readings at the San Juan River gauge. A modeled base flood, not what flooded.
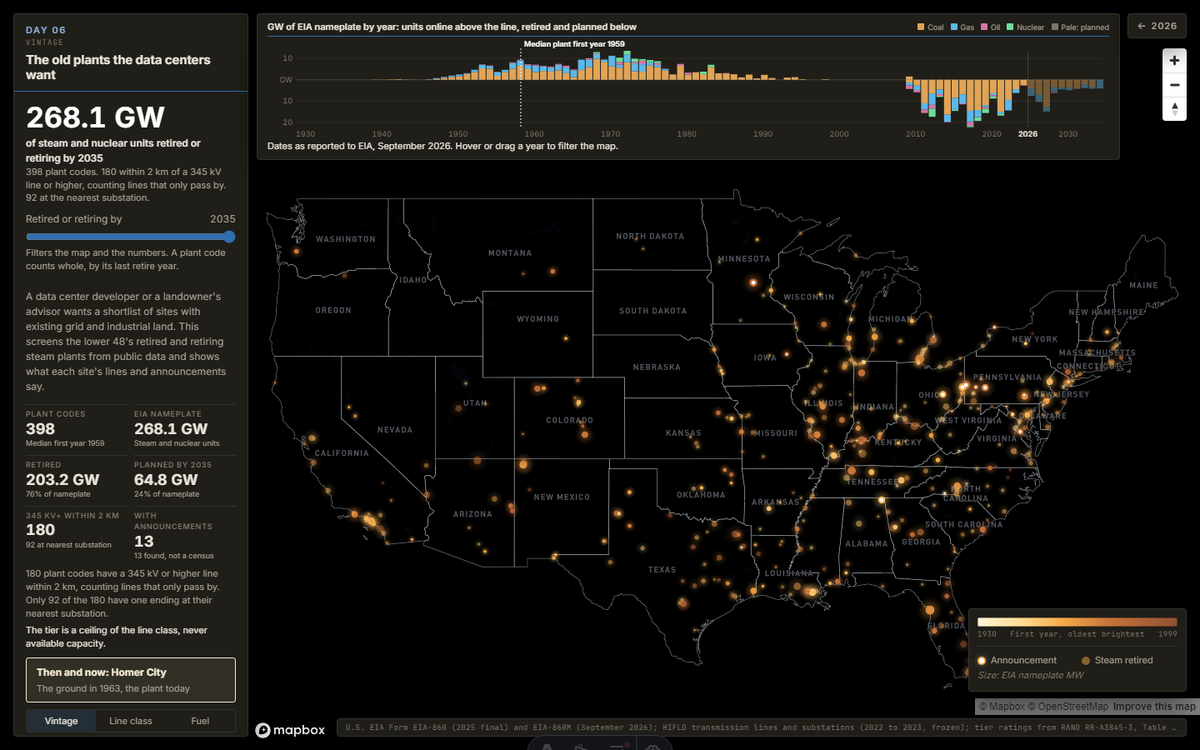
The old plants the data centers want
Retired and retiring US steam plants by year, with the line class near each one and the data center announcements found so far. At Homer City, a 1963 USGS sheet shows the ground before the plant.
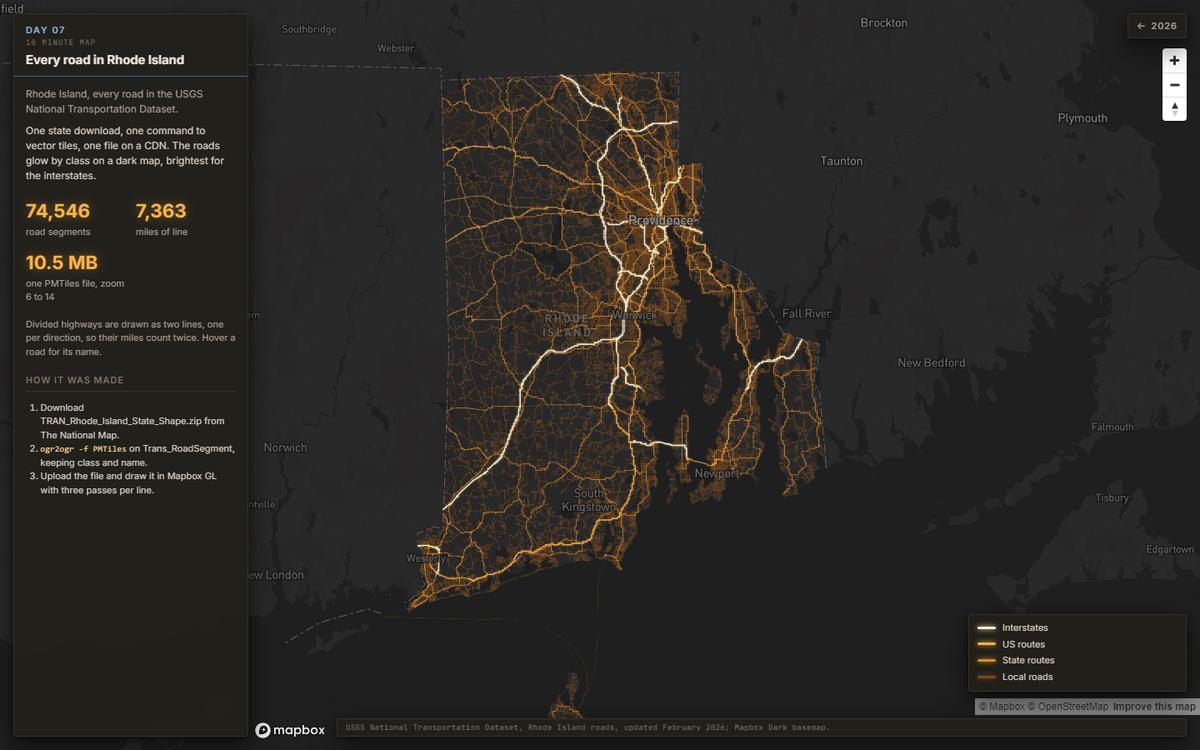
Every road in Rhode Island
The USGS road network for one state, from download to vector tiles to a glowing web map in under ten minutes: 74,546 segments as vector tiles.
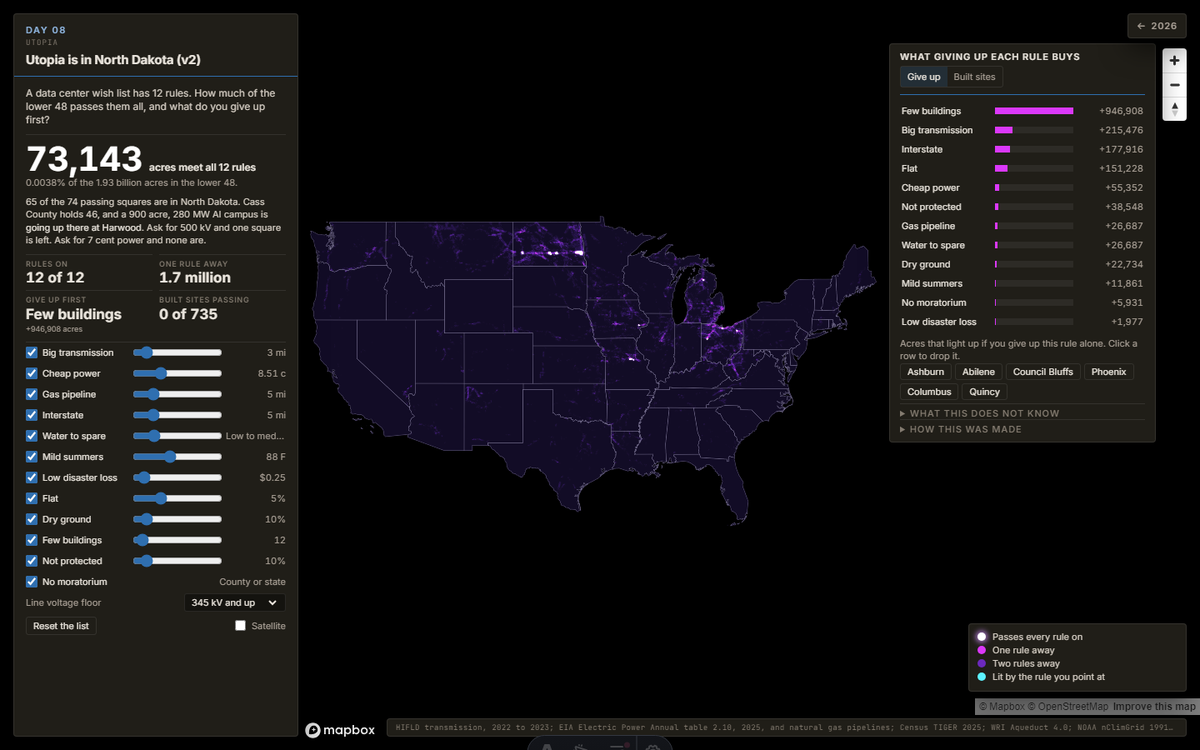
Utopia is in North Dakota
Twelve rules from a data center wish list, run over every 988 acre square of the lower 48. 74 squares pass, 65 of them in North Dakota. Drop a rule and watch what it buys.
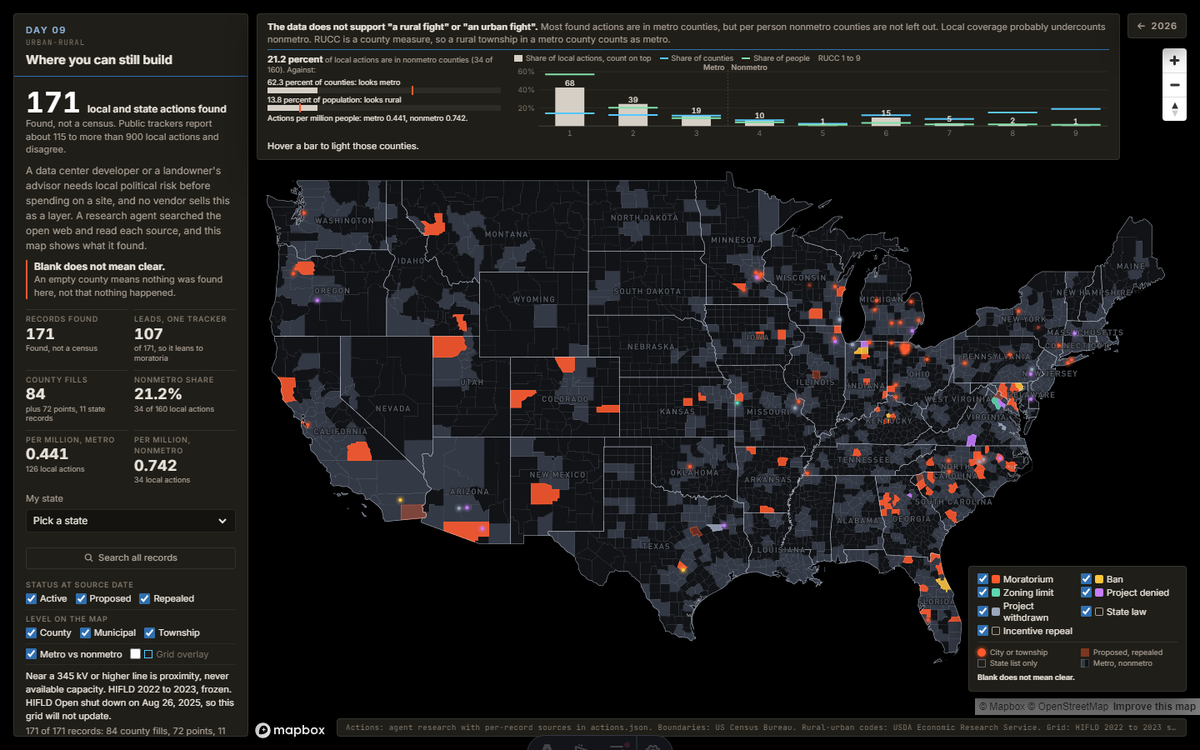
Where you can still build
Local data center moratoria, bans, denials and withdrawals from the Moratorium Nation inventory and agent research, set against rural-urban codes. Found, not a census. Blank does not mean clear.
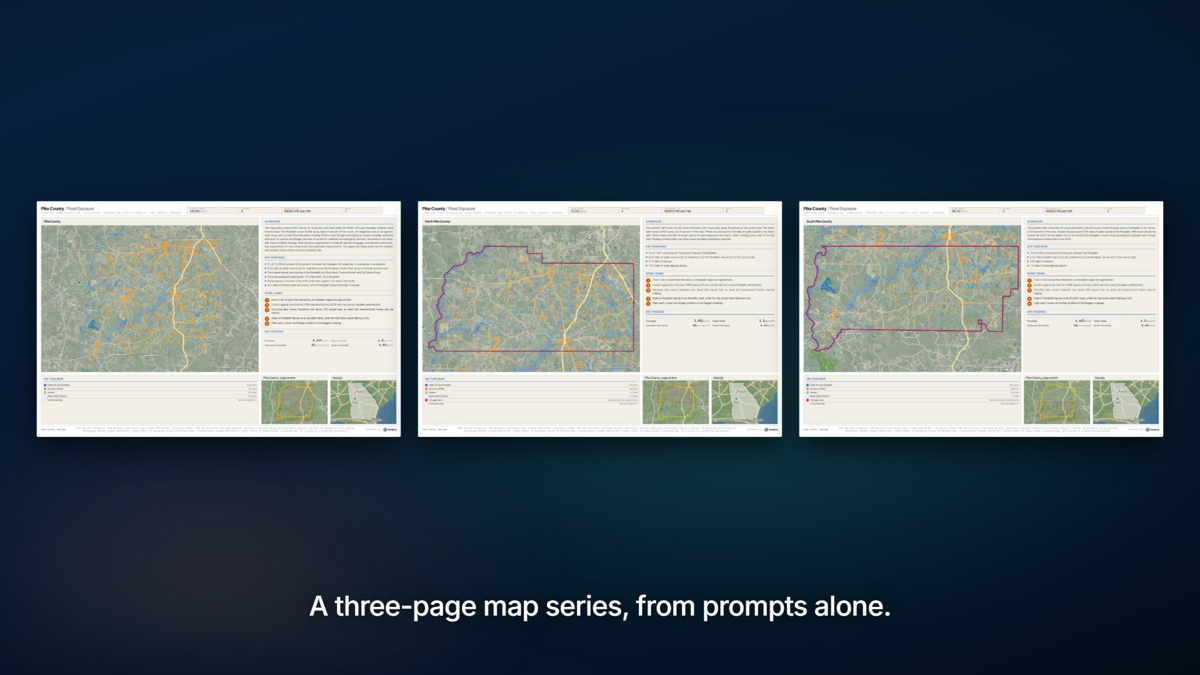
Pike County flood exposure, by prompt
Seven plain English prompts to the Trendline MCP, no code: pull the FEMA floodplain, structures, streams and roads for Pike County, Georgia, count what sits in the floodplain, and print a three page PDF map series.
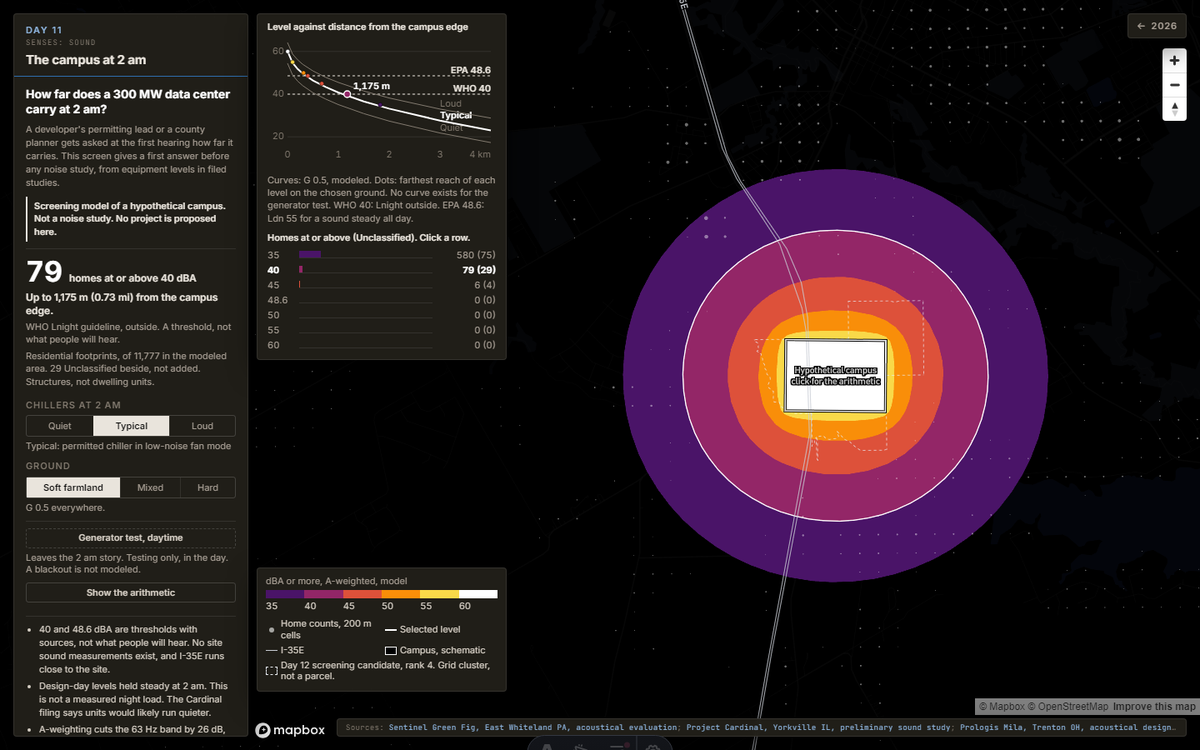
The campus at 2 am
A screening model of a hypothetical 300 MW data center campus: pick the chillers and the ground, and the homes at or above each level recount at once. Not a noise study. No project is proposed here.
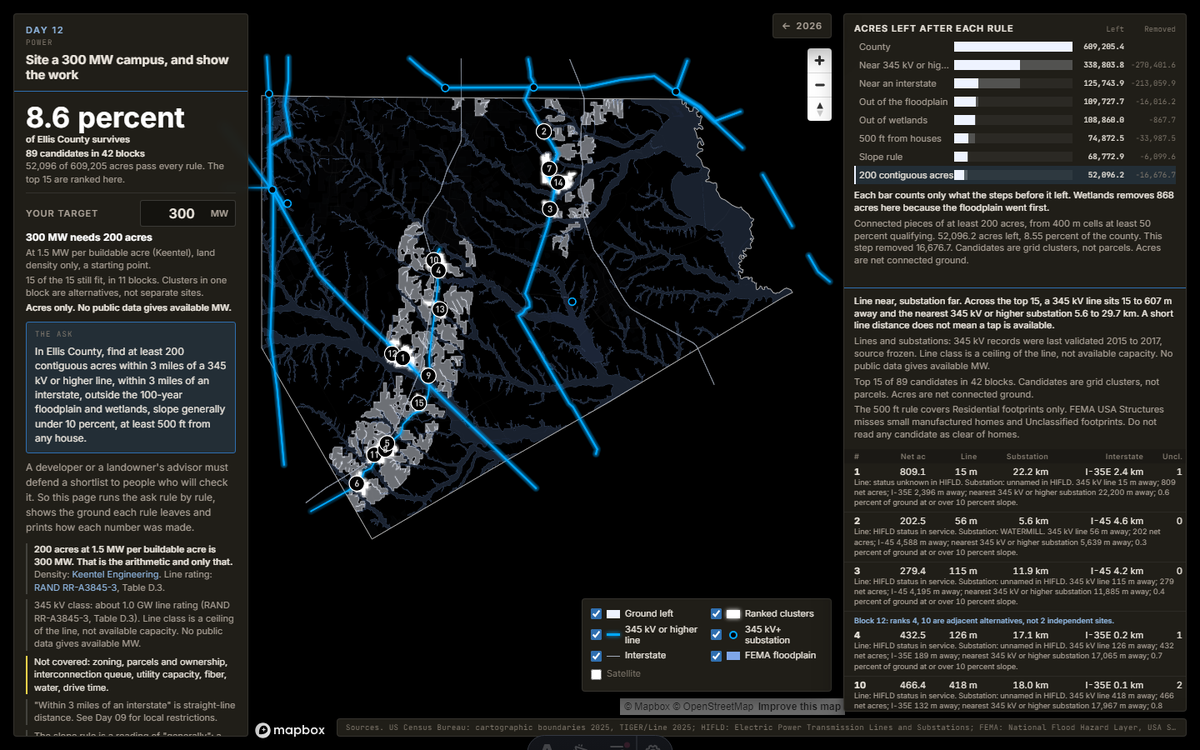
Site a 300 MW campus, and show the work
A data center siting ask run rule by rule in Ellis County, Texas: the ground each rule leaves, the top clusters ranked, and every step on the receipts. Ground only. No public data gives available MW.
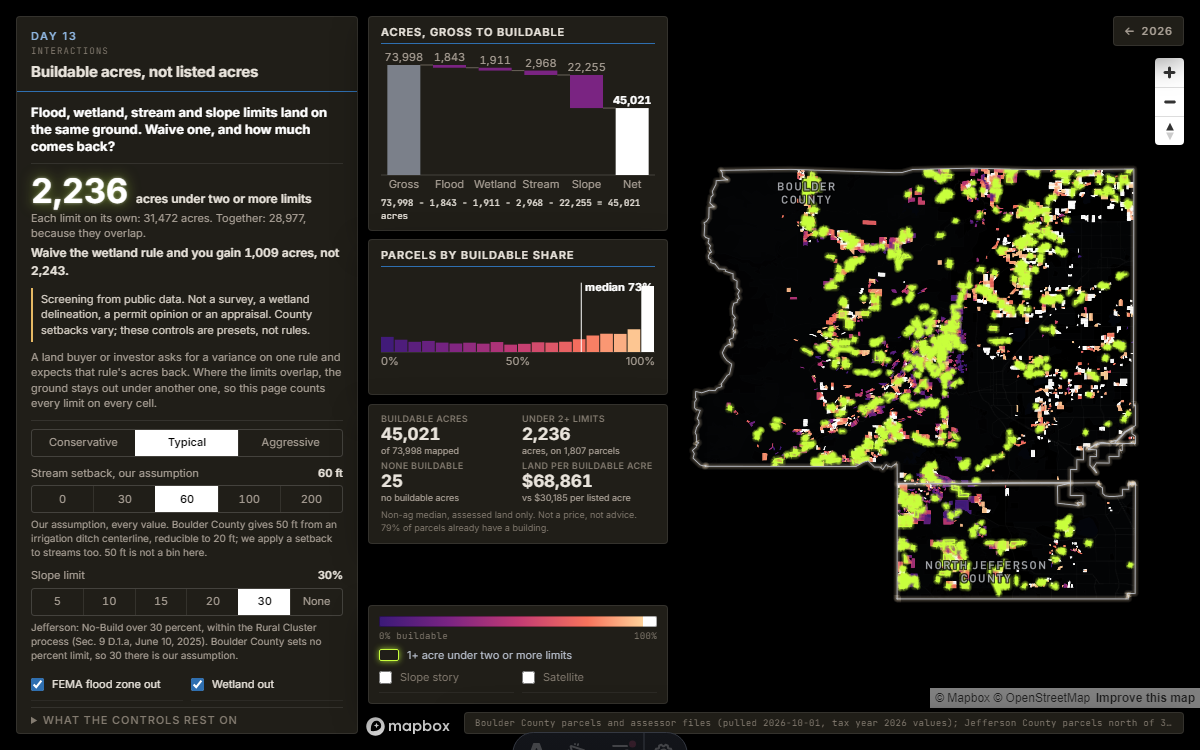
Where the limits overlap
Locked until release day.
Unlocks Nov 13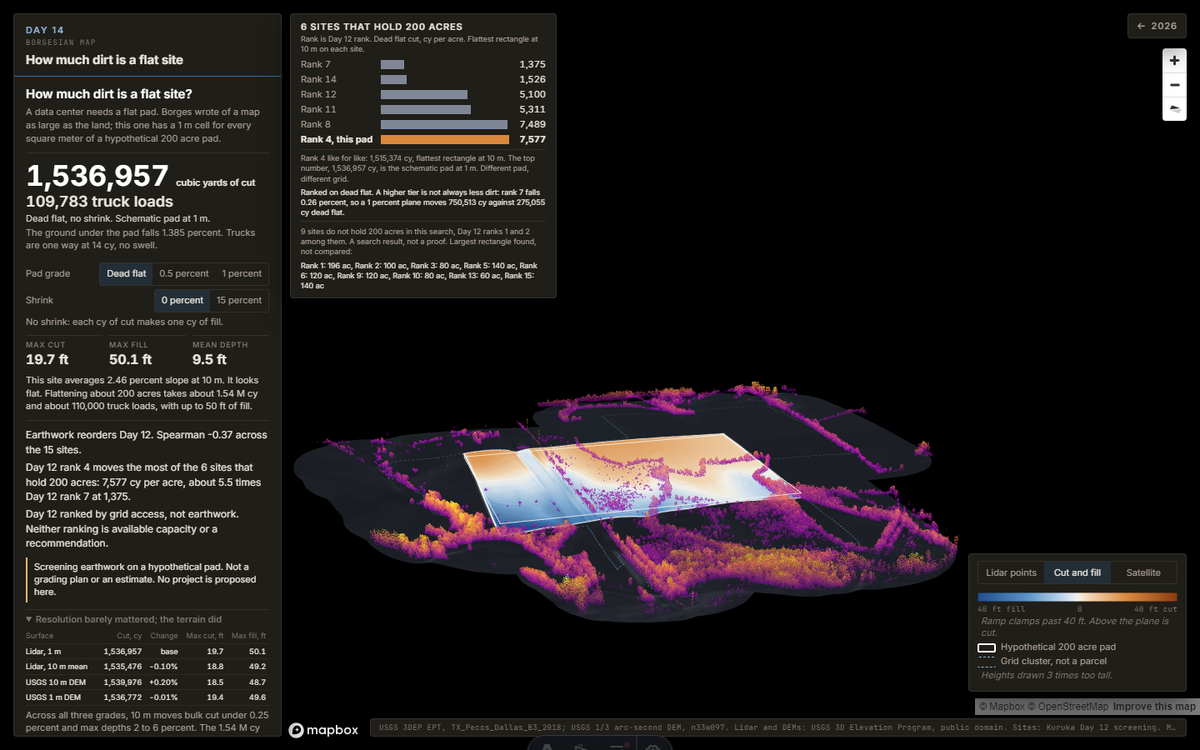
How much dirt is a flat site
Locked until release day.
Unlocks Nov 14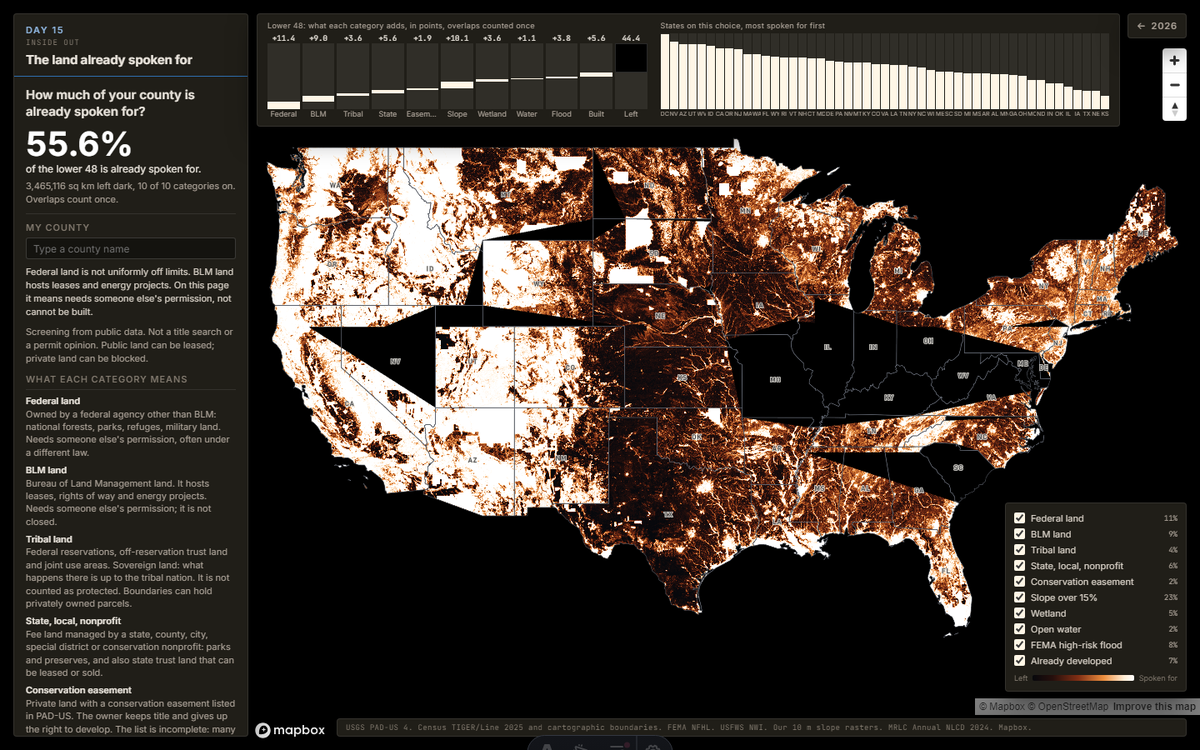
The land already spoken for
Locked until release day.
Unlocks Nov 15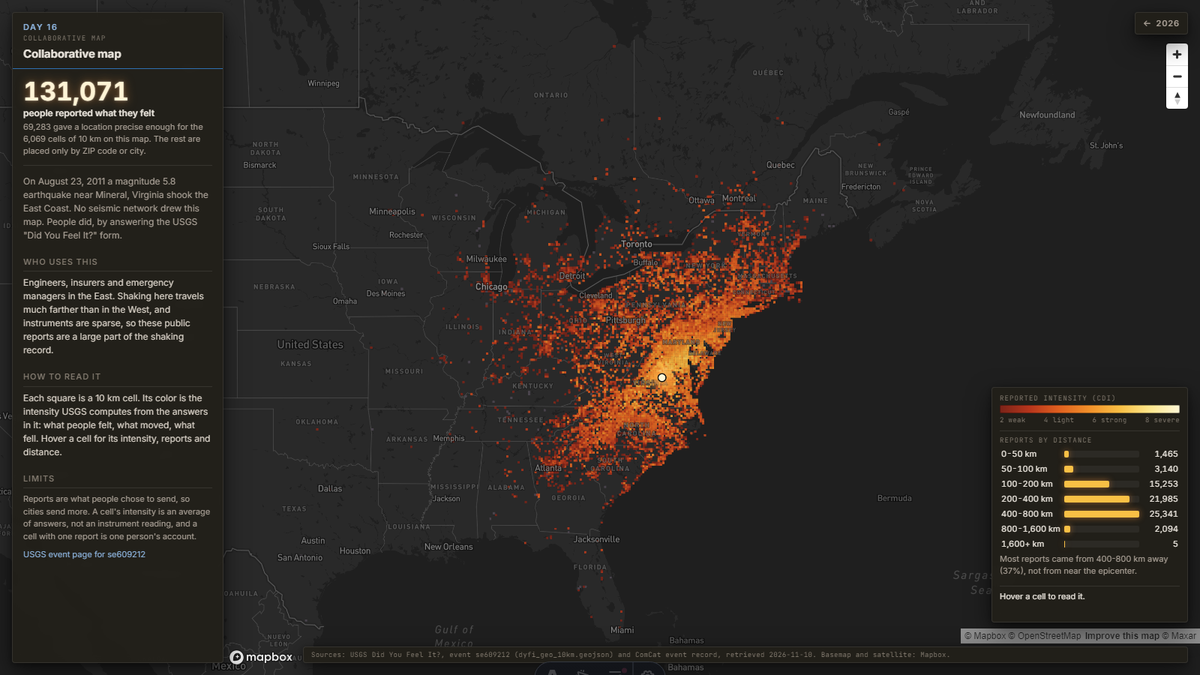
131,071 people drew this map
Locked until release day.
Unlocks Nov 16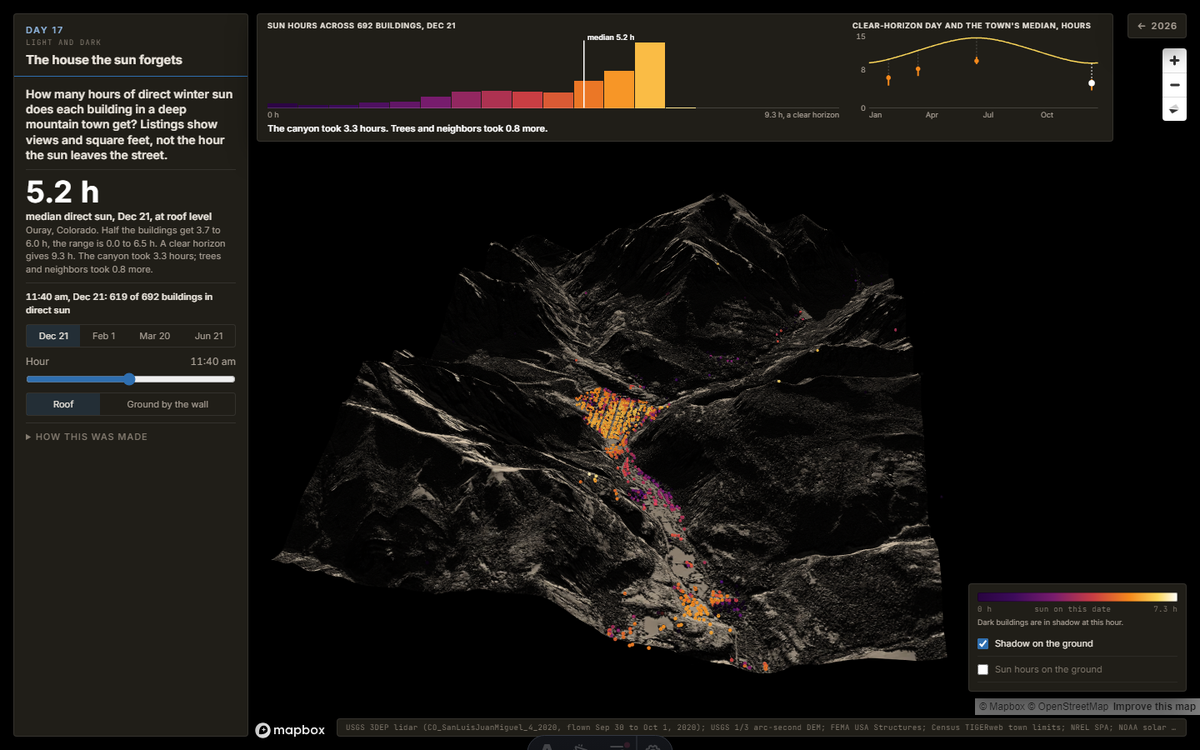
The house the sun forgets
Locked until release day.
Unlocks Nov 17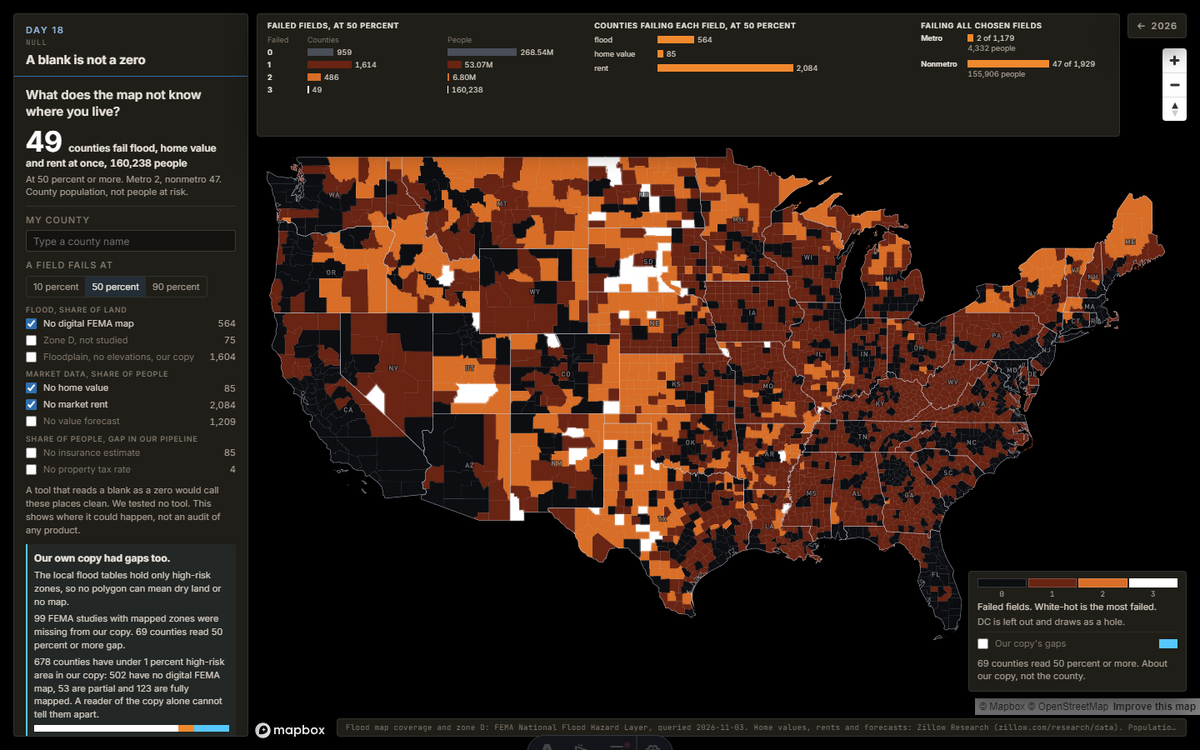
A blank is not a zero
Locked until release day.
Unlocks Nov 18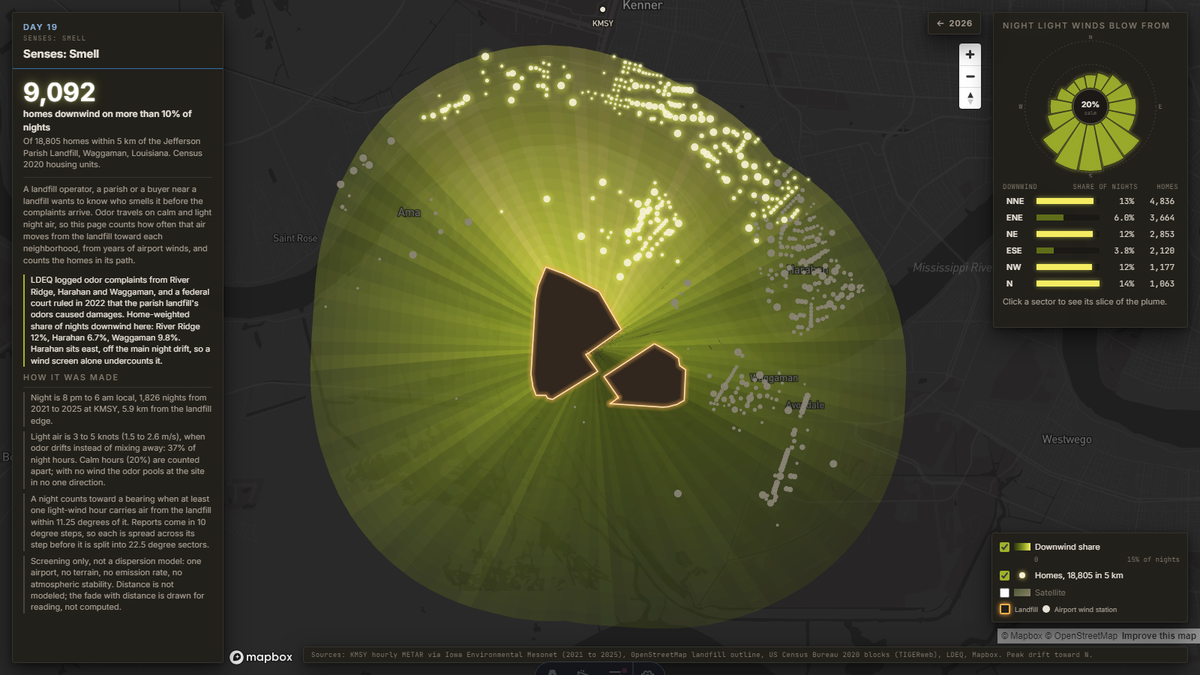
Downwind of the landfill
Locked until release day.
Unlocks Nov 19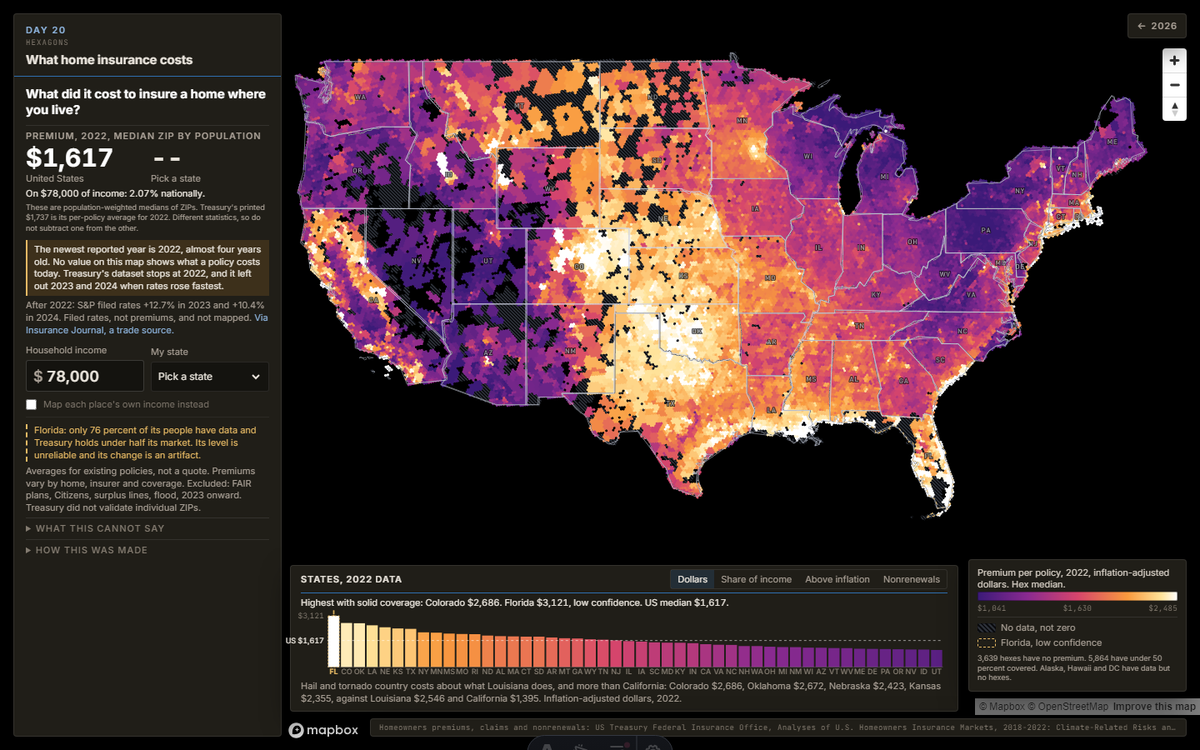
What home insurance costs
Locked until release day.
Unlocks Nov 20OpenStreetMap
Locked until release day.
In the worksProjections
Locked until release day.
In the worksSenses: Taste
Locked until release day.
In the worksNetwork
Locked until release day.
In the worksIs this a map?
Locked until release day.
In the worksWater
Locked until release day.
In the worksNew tool
Locked until release day.
In the worksSenses: Feeling
Locked until release day.
In the worksRaster
Locked until release day.
In the worksPen and paper
Locked until release day.
In the worksHow these maps are served
Point clouds are COPC files read by HTTP range requests, so the browser pulls only the octree nodes it needs for the current view. Rasters are cloud optimized GeoTIFFs read the same way. Vectors are PMTiles. All of it sits in one object storage bucket behind a CDN. The lidar is USGS 3DEP; parcels, floodplains and the other layers come from public county, state and federal sources, named on each map. Nothing here is client data.